CLI Reference
This page summarizes the main command-line tools provided by epica. The package installs both epa and epica; this page uses epa in examples, but the two commands are interchangeable.
Command Overview
Core pipeline:
epaorepica: run the full alignment and evaluation pipeline
Trajectory and metric tools:
epa_traj: inspect, synchronize, align, transform, plot, and export trajectoriesepa_ape: compute absolute pose error metricsepa_rpe: compute relative pose error metricsepa_res: compare result bundles, run directories, or metrics files
Utilities:
epa_config: manage reusable global and tool-level defaultsepa_fig: re-render plots from serialized plot bundles
Benchmark tools are documented separately in Benchmark Workflow.
Shared Concepts
Supported Formats
Most tools support these input formats:
autocsveuroctumkittibagbag2mcap
For ROS log formats, install:
python -m pip install "epica[ros]"
Topics for ROS Inputs
For ROS logs, you usually need to provide a topic:
epa /path/to/run.bag /path/to/run.bag \
  --gt-format bag --gt-topic /vicon/pose \
  --est-format bag --est-topic /odom
For epa_traj, you can also encode the topic inside each trajectory spec:
epa_traj --format bag /path/to/run.bag::/vicon/pose /path/to/run.bag::/odom --plot
Time Association
Several tools match trajectories by timestamp before computing metrics.
Key options:
t_offset: shifts estimation timestamps before matchingt_max_diff: maximum residual timestamp difference allowed for a valid matcht_startandt_end: crop trajectories to a time window before evaluation
Guidelines:
- Use smaller
t_max_diffvalues when timestamps are already well aligned - Increase
t_max_diffonly when you know the logs are sparse or noisy - Use
t_offsetwhen one trajectory is consistently ahead of or behind the other
Help Commands
epa --help
epa_traj --help
epa_ape --help
epa_rpe --help
epa_res --help
epa_config --help
epa / epica
epa / epica is the main entry point. It loads a reference trajectory and an estimated trajectory, runs the alignment pipeline, computes metrics, and writes plots, reports, and interactive_report.html into a new run directory.
Common options:
- positional
<gt_file>or--gt: reference trajectory path --gt-format: reference format--gt-topic: reference topic for ROS logs- positional
<est_file>or--est: estimation trajectory path --est-format: estimation format--est-topic: estimation topic for ROS logs--mode {se3,posyaw,sim3}: public evaluation mode--t-max-diff: maximum timestamp association gap--t-offset: constant offset applied to estimation timestamps before sync--plotand--no-plot: enable or disable metric plot generation--debug: generate extra diagnostic figures, including raw/intermediate/final trajectory comparison--save-results: write a bundled result zip--save-full-metrics: keep full per-sample APE/RPE arrays inmetrics.json--rerun: enable Rerun logging
Minimal example:
epa example_data/example_groundtruth.csv example_data/example_estimation.txt
With result bundle export:
epa example_data/example_groundtruth.csv example_data/example_estimation.txt \
  --save-results outputs/results/run_a.zip
EPA Alignment Modes
Use --mode to select the public alignment mode reported by the main pipeline.
The current public EPA modes are:
| mode | transform | scale | intended use |
|---|---|---|---|
se3 |
full 3D rotation + 3D translation | fixed 1.0 |
metric-scale trajectories, especially VIO/odometry where GT and estimate should already share metric scale |
sim3 |
3D rotation + 3D translation + one global scale | estimated | scale-ambiguous visual SLAM / visual odometry cases, for example when GT is metric but the estimate may not be |
posyaw |
yaw-only rotation + 3D translation | fixed 1.0 |
gravity-aligned VIO cases where roll/pitch should be preserved and only global yaw/position should be aligned |
Mode selection rule of thumb:
- Use
se3by default for metric-scale VIO/odometry. - Use
sim3only when the estimate has unknown or unreliable scale. - Use
posyawwhen yaw is the only unobservable global rotation and roll/pitch consistency must remain visible in the metrics.
Compatibility note: older internal aliases such as epa_se3, epa_posyaw, and
epa_sim3 are still accepted by some advanced tools, but new commands and docs
should use only se3, posyaw, and sim3.
Representative one-case commands from the local AlignAnything2 layout:
# se3: metric-scale VIO / odometry
epa \
  --gt /home/yifu/epa_data/AlignAnything2/AlignAnything2/GT/lamaria/cp/R_11_5cp.txt \
  --gt-format tum \
  --est /home/yifu/epa_data/AlignAnything2/AlignAnything2/benchmark/lamaria/cp/pose/rovio/R_11_5cp/rovio_poses.txt \
  --est-format tum \
  --mode se3 \
  --output-root outputs/mode_examples \
  --run-label lamaria_R_11_5cp_rovio_se3
# sim3: scale-ambiguous visual SLAM / visual odometry
epa \
  --gt /home/yifu/epa_data/AlignAnything2/AlignAnything2/GT/aqualoc/archaeo/archaeo1/archaeo_sequence_4.txt \
  --gt-format tum \
  --est /home/yifu/epa_data/AlignAnything2/AlignAnything2/benchmark/archaeo/pose/svo_stereo/archaeo_sequence_4/svo_poses.txt \
  --est-format tum \
  --mode sim3 \
  --output-root outputs/mode_examples \
  --run-label aqualoc_archaeo_sequence_4_svo_stereo_sim3
# posyaw: gravity-aligned VIO, yaw + translation only
epa \
  --gt /home/yifu/epa_data/AlignAnything2/AlignAnything2/GT/euroc_mav/MH_04_difficult.txt \
  --gt-format tum \
  --est /home/yifu/epa_data/AlignAnything2/AlignAnything2/benchmark/euroc_mav/pose/rovio/MH_04_difficult/rovio_poses.txt \
  --est-format tum \
  --mode posyaw \
  --output-root outputs/mode_examples \
  --run-label euroc_mav_MH_04_difficult_rovio_posyaw
Report Outputs
Each run writes Markdown reports (report_en.md, report_zh.md) and a supplementary interactive_report.html.
The default report is user-facing:
- final aligned trajectory plots are emphasized
- raw/intermediate/final comparison figures are hidden unless
--debugis used - clipped/core metric plots are prioritized so outliers do not compress the readable range
- full-scale metric plots remain available in the figure gallery
pose_states.csvexports per-timestamp position, orientation, linear velocity, and angular velocity
Use --debug when you want intermediate-stage figures, especially the raw/intermediate/final trajectory comparison.
Case diagnostics are written into the reports and metrics payload. Tags such as time_alignment_weak, trajectory_jump, scale_or_unit_suspect, and gt_mapping_suspect are warnings to guide inspection. orientation_unstable is also a warning and does not change the translation successful rate.
Optional Rerun inspection flow for the main epa / epica pipeline.
epa_traj
epa_traj is the general trajectory utility. Use it to inspect, synchronize, align, plot, or export trajectories.
Common options:
--format: input format for all trajectories--topic: default topic for bag-style inputs--sync: associate all non-reference trajectories to the reference by timestamp--sync-max-diff: timestamp tolerance for--sync--sync-offset: constant timestamp offset before--sync--align: align non-reference trajectories to the reference--correct-scale: enable scale correction with alignment--ref: reference trajectory label or 1-based index--plot: generate plots--plot-mode: choosexy,xz,yz, orxyz--save-as: export loaded trajectories in another format--out-dir: output directory for exported files or generated outputs
Plot two TUM trajectories:
epa_traj --format tum --plot --plot-mode xz gt.tum est.tum
Synchronize and align to the first trajectory:
epa_traj --format tum --sync --align --ref 1 gt.tum est.tum --plot
Export trajectories as TUM:
epa_traj \
  --format auto \
  --save-as tum \
  --out-dir outputs/traj_exports \
  example_data/example_groundtruth.csv example_data/example_estimation.txt
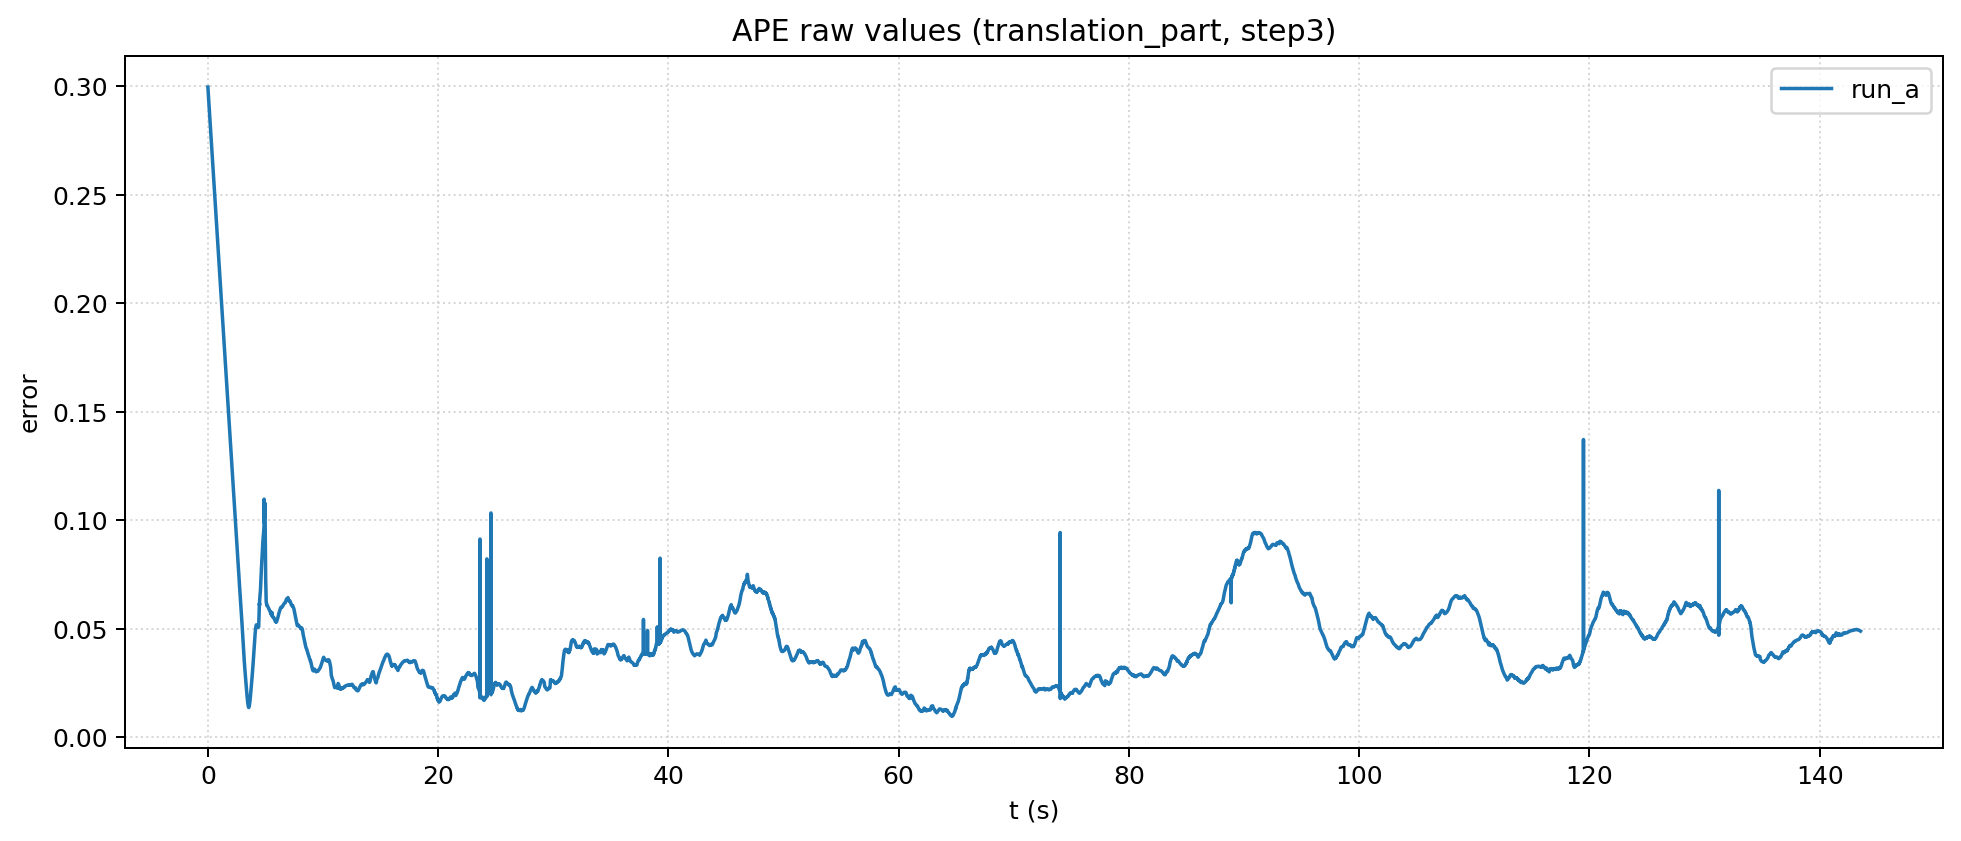
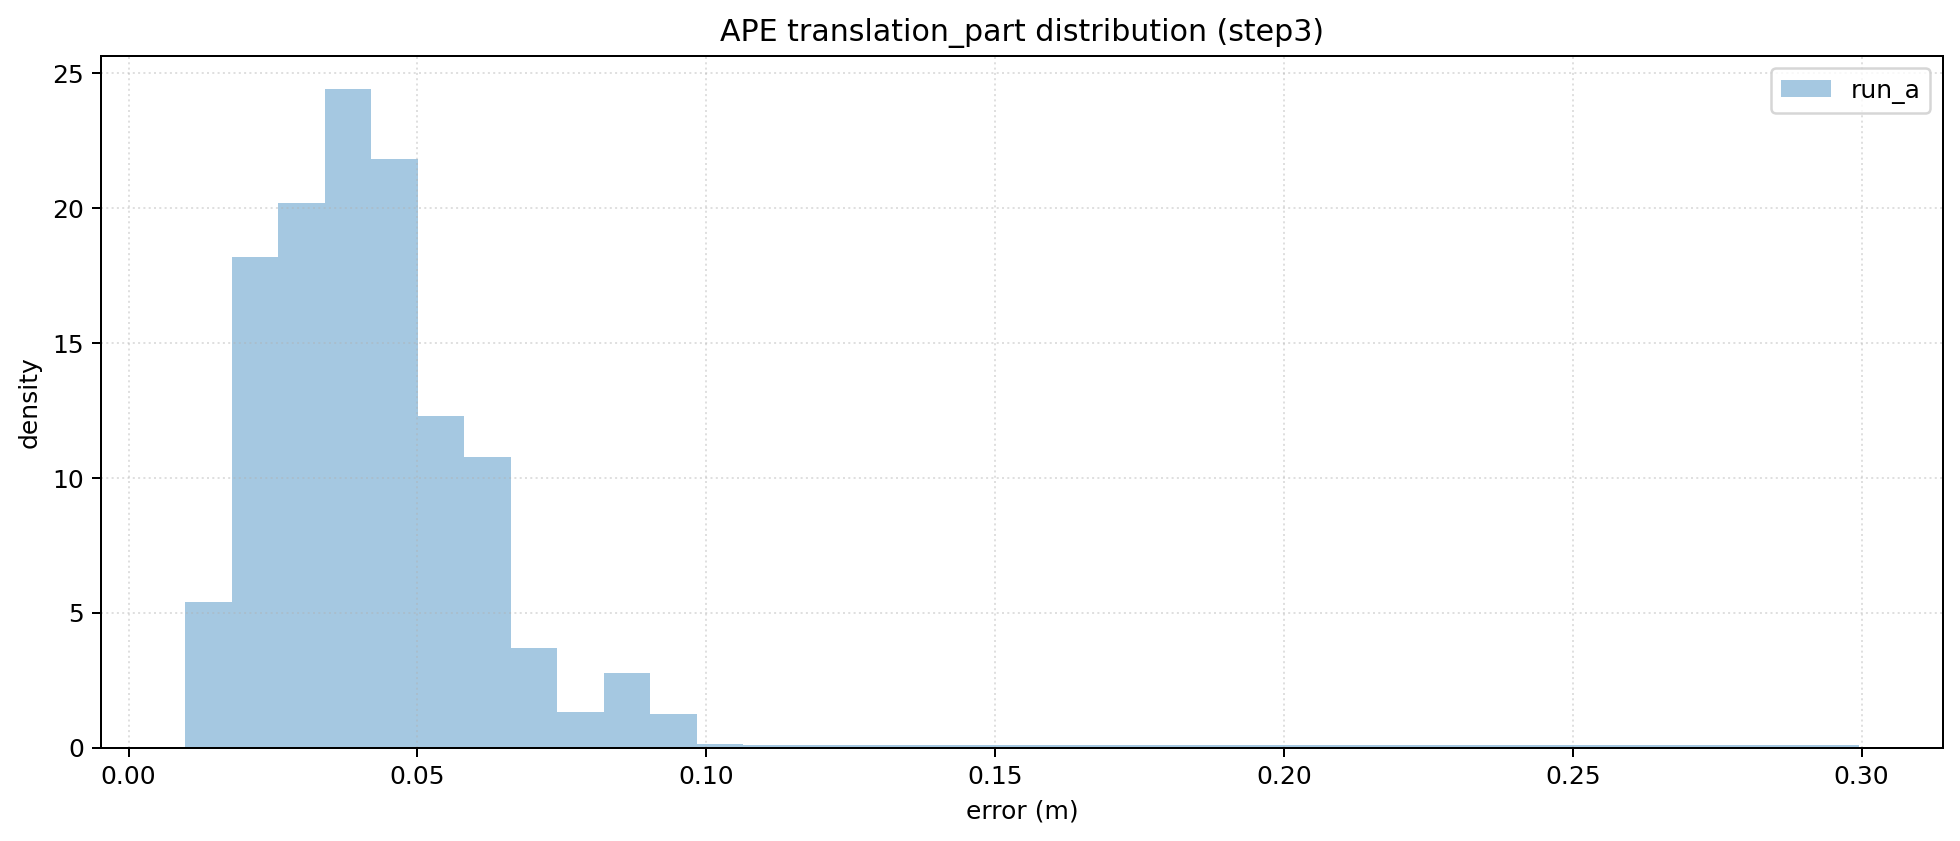
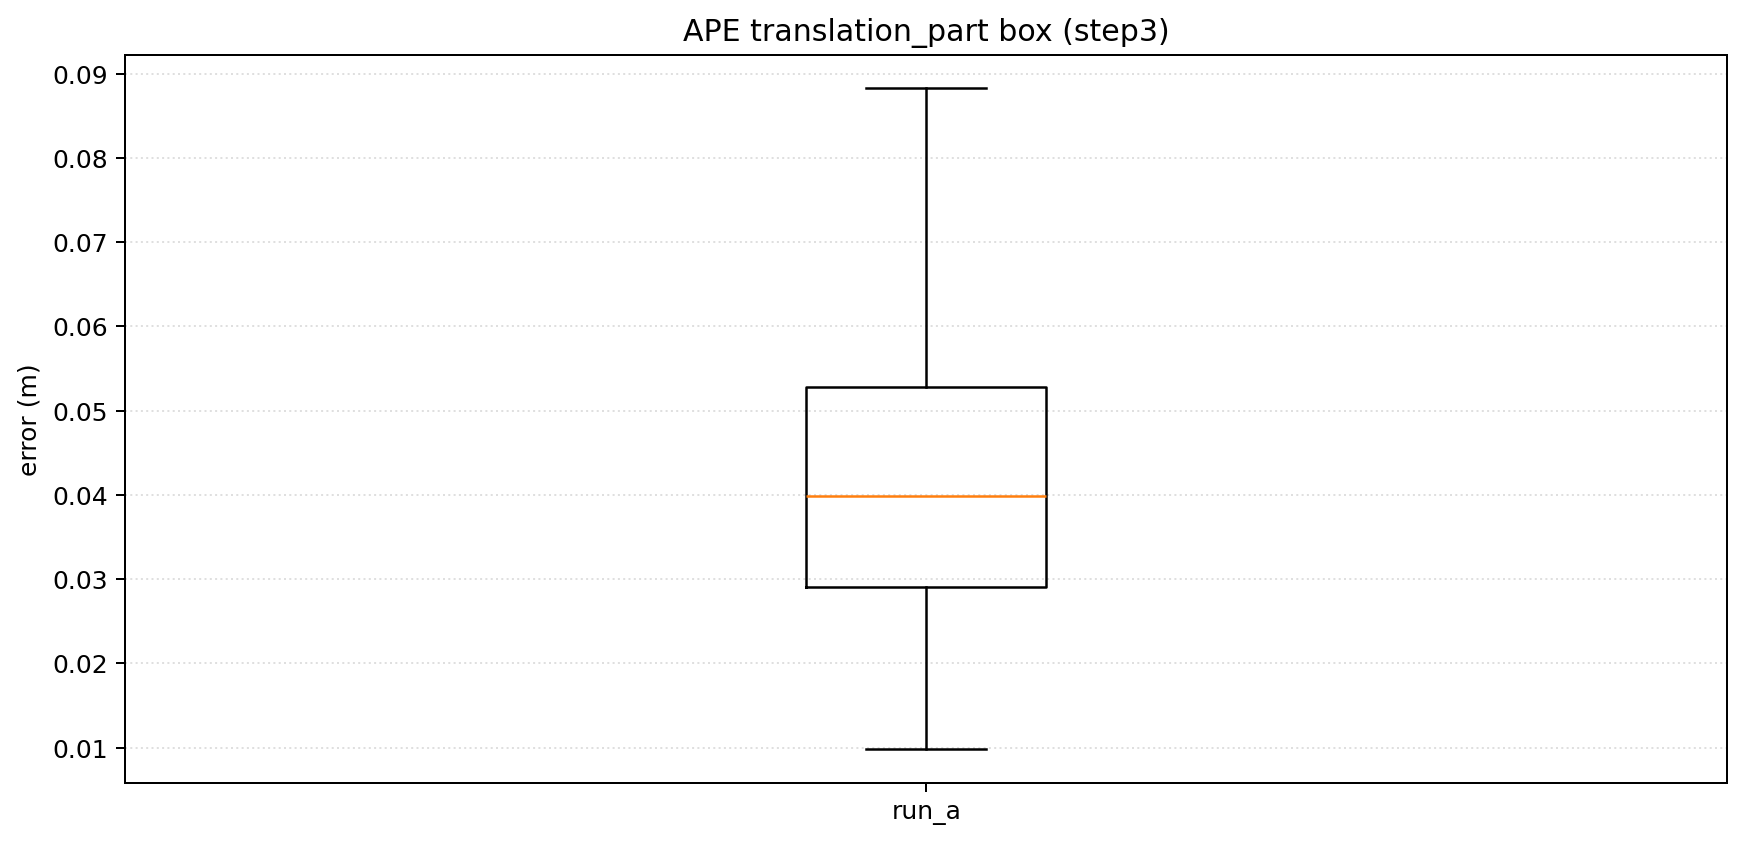
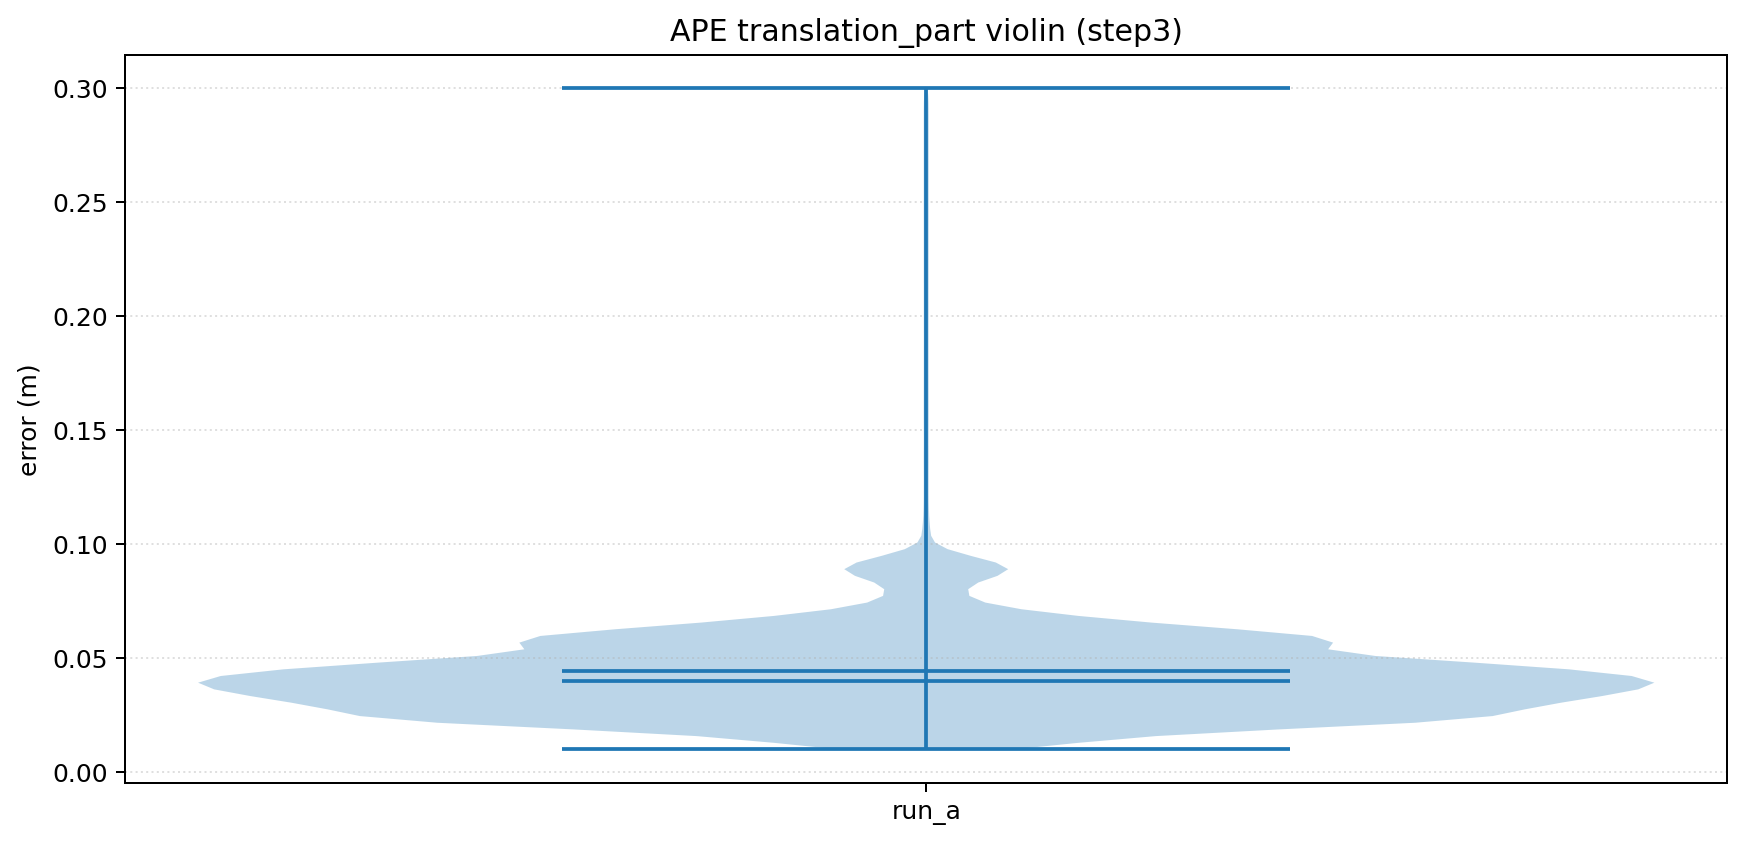
epa_ape
epa_ape computes absolute pose error between a reference trajectory and an estimated trajectory.
Common options:
--pose_relation: metric relation such astrans_part,rot_part,angle_deg, orfull--align: run SE(3) alignment before evaluation--correct_scale: enable scale correction--align_origin: align the first pose to the reference origin--t_max_diff: timestamp matching tolerance--t_offset: constant timestamp shift before matching--plot: generate metric plots--save_results: export a result zip--serialize_plot: save a reusable plot bundle
Example:
epa_ape tum gt.tum est.tum \
  --pose_relation trans_part \
  --align \
  --t_max_diff 0.02 \
  --plot
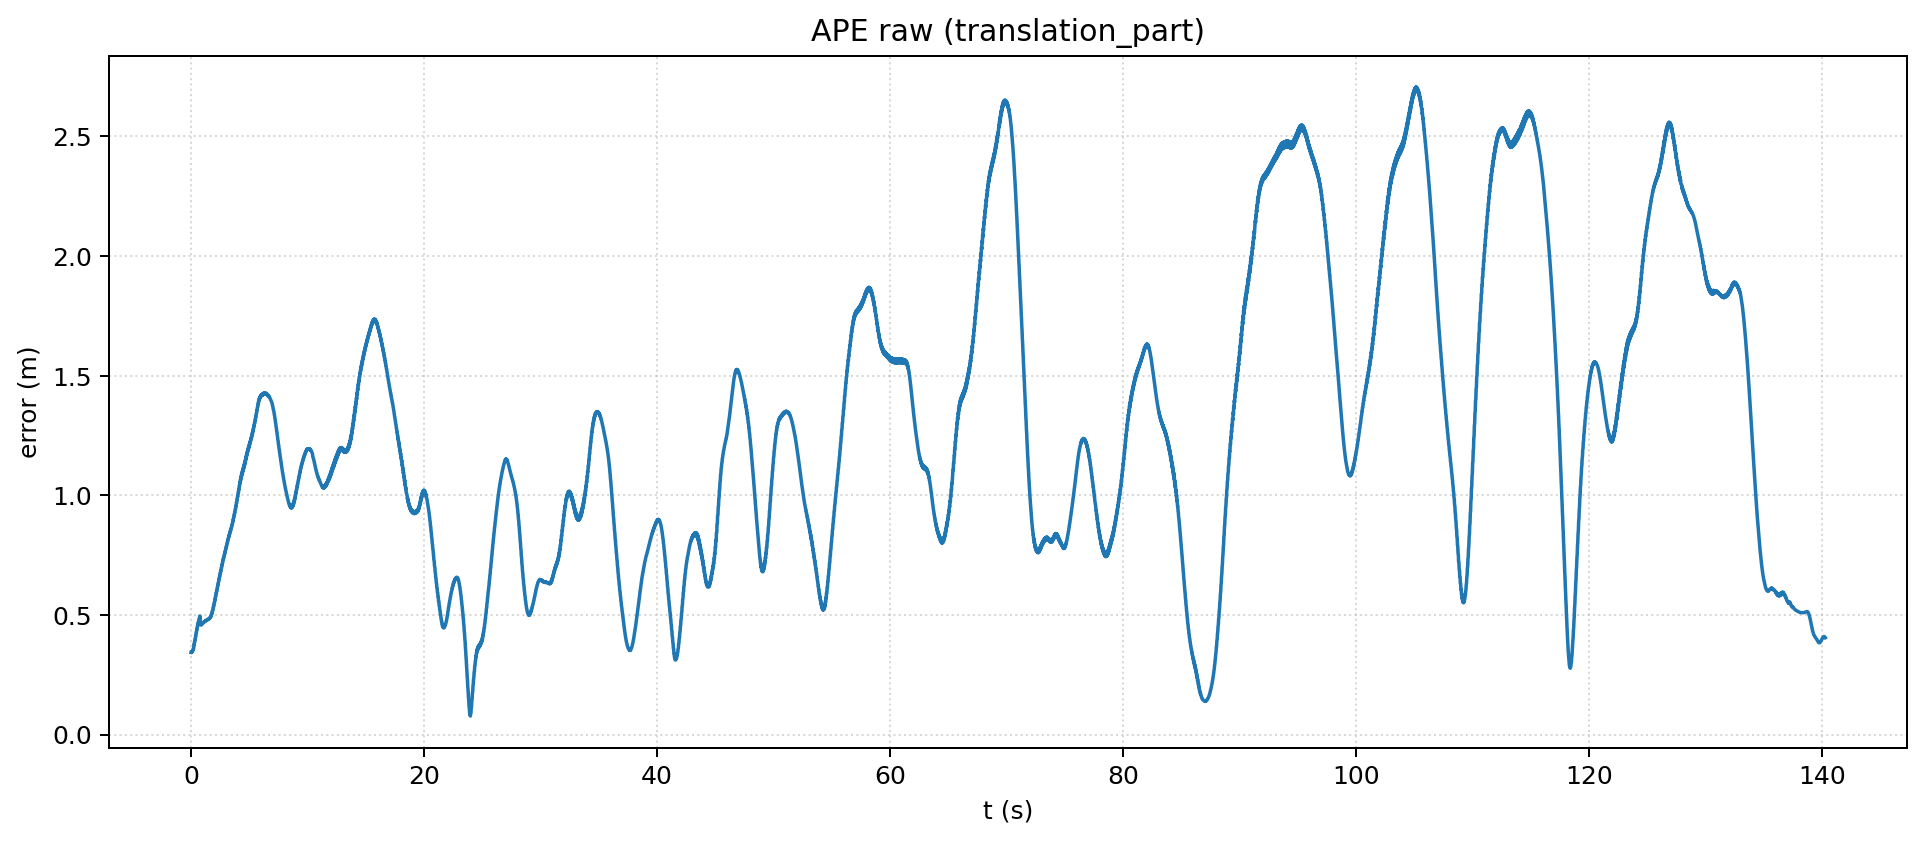
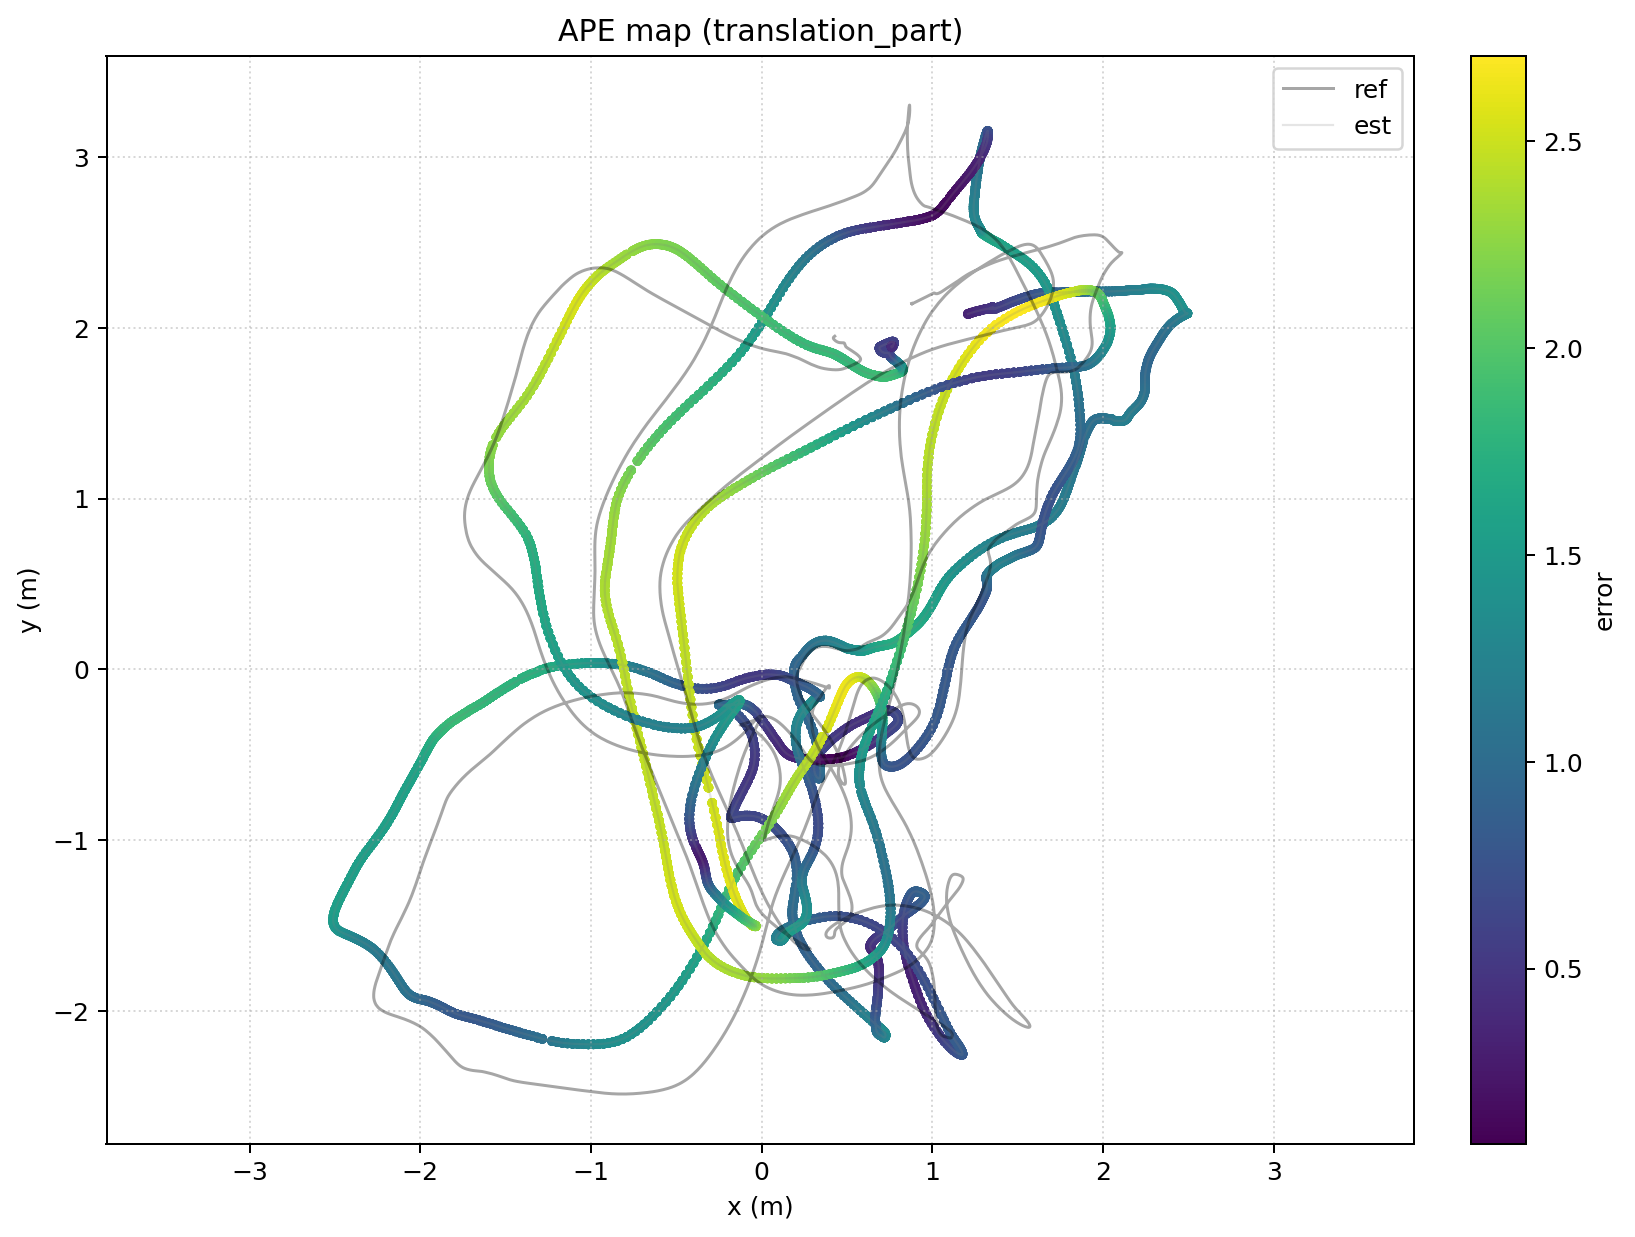
Example epa_ape outputs: raw error curve and map-colored trajectory.
Save a reusable plot bundle:
epa_ape tum gt.tum est.tum \
  --pose_relation trans_part \
  --serialize_plot outputs/ape_plot.json
epa_rpe
epa_rpe computes relative pose error. The key extra concept is delta, which defines the spacing between pose pairs.
Common options:
--pose_relation: metric relation such astrans_part,rot_part, orpoint_distance_error_ratio--delta: separation between pose pairs--delta_unit:ffor frames,mfor meters,dfor degrees,rfor radians,sfor seconds--delta_tol: relative tolerance used in all-pairs mode for non-frame deltas--all_pairs: use all candidate pairs--pairs_from_reference: build RPE pairs from the reference instead of the estimate--align: run SE(3) alignment before evaluation--plot: generate metric plots
Example:
epa_rpe tum gt.tum est.tum \
  --pose_relation trans_part \
  --delta 1 \
  --delta_unit f \
  --all_pairs \
  --align \
  --plot
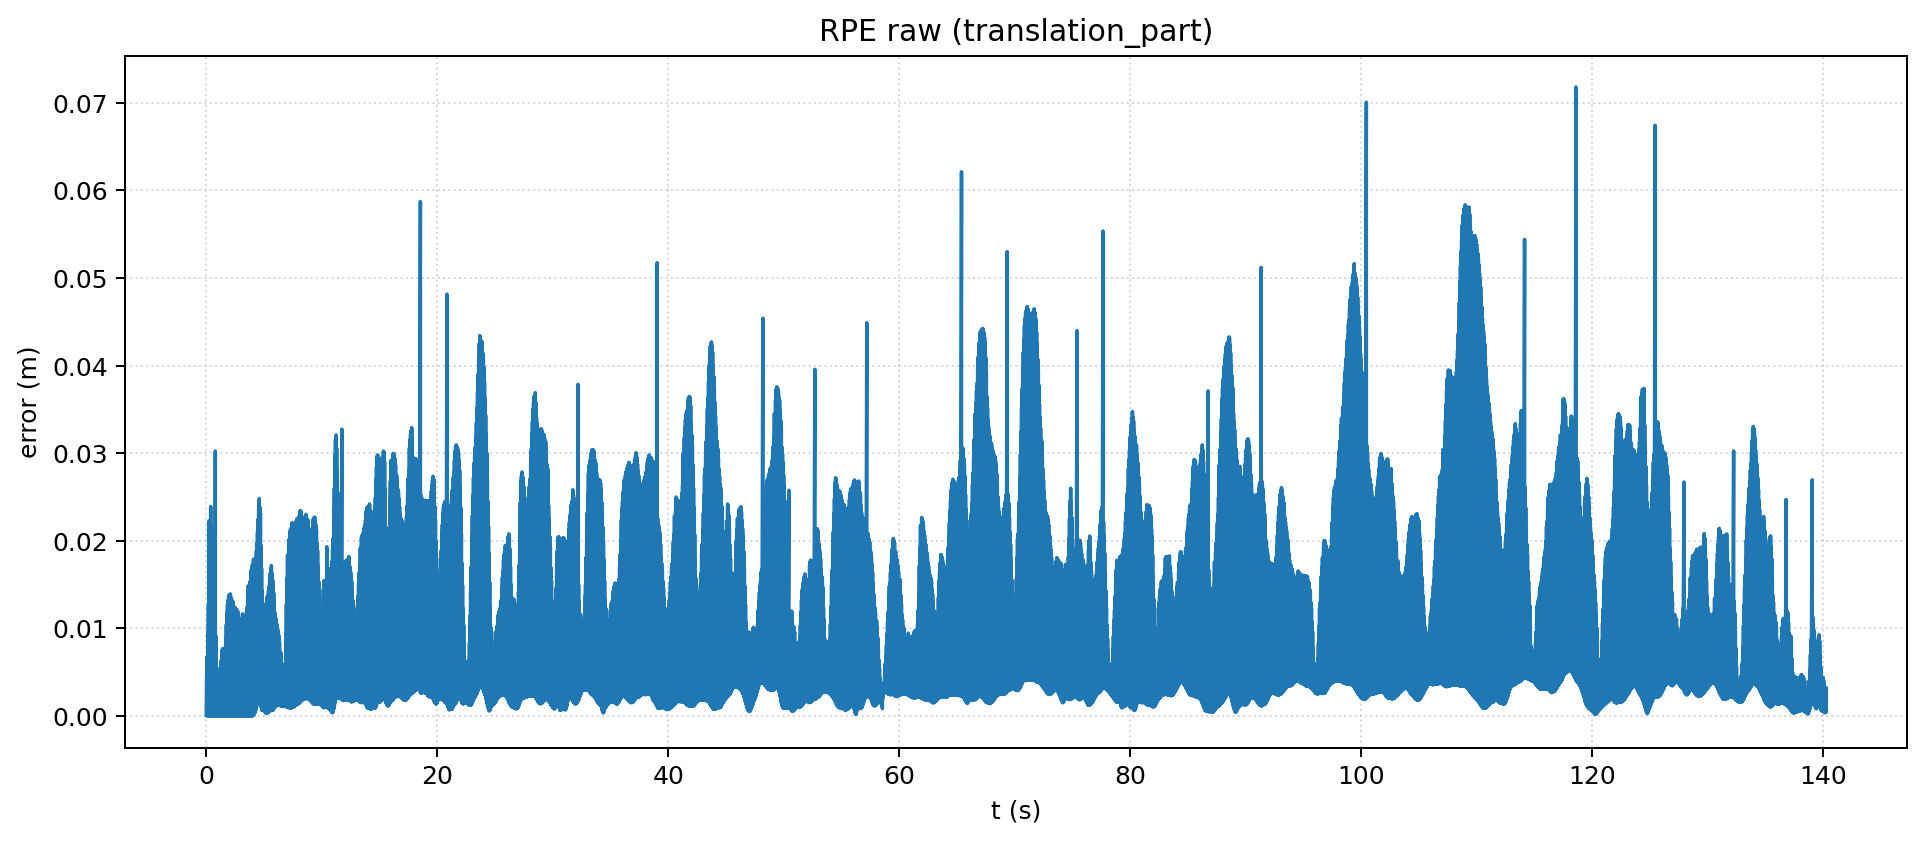
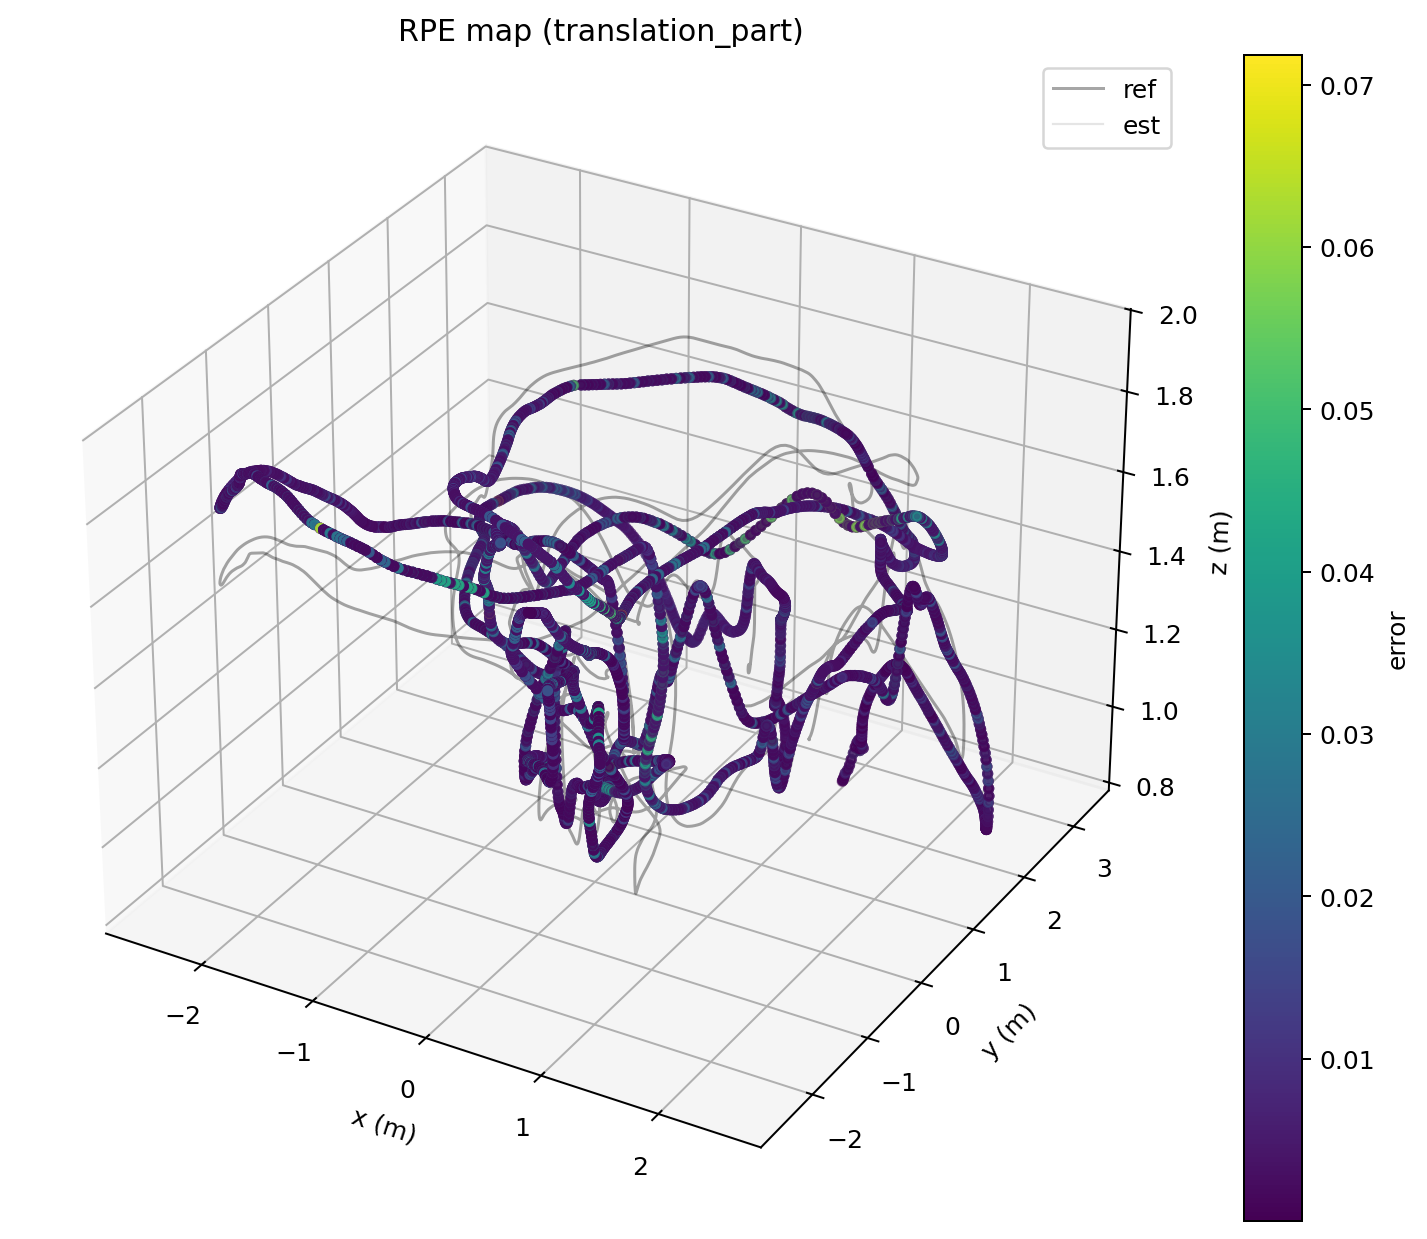
Example epa_rpe outputs: raw relative error curve and map-colored trajectory.
Path-based RPE example:
epa_rpe tum gt.tum est.tum \
  --pose_relation trans_part \
  --delta 1.0 \
  --delta_unit m \
  --all_pairs
Time-based RPE example:
epa_rpe tum gt.tum est.tum \
  --pose_relation trans_part \
  --delta 1.0 \
  --delta_unit s \
  --all_pairs
epa_res
epa_res compares previous evaluation outputs. Each input can be:
- a
.zipresult bundle - a
metrics.jsonfile - a run directory containing
metrics.json
Common options:
--metric: compareape,rpe, orall--stage: selectraw,step2, orstep3--stat: choose the statistic to compare such asrmse,mean, ormedian--plot: generate comparison plots--out-dir: directory for generated outputs--save-plot: export plots--save-table: export a comparison table
Example:
epa_res outputs/results/run_a.zip outputs/results/run_b.zip \
  --metric all \
  --stage step3 \
  --plot \
  --out-dir outputs/res_compare
Example epa_res outputs for multi-run comparison.
epa_config
epa_config manages reusable defaults so you do not need to repeat the same flags.
It supports:
- root-level defaults shared across tools
- tool-specific defaults such as
epa_apeorepa_traj - generated template configs for supported tools
Common commands:
Show current settings:
epa_config show
Show effective config for one tool:
epa_config show --tool epa_ape
Set shared defaults:
epa_config set plot false rpe_delta 3
Set tool-specific defaults:
epa_config set --tool epa_ape plot_mode xy t_max_diff 0.05
epa_config set --tool epa_traj plot_mode xyz sync_max_diff 0.01
Generate a template config:
epa_config generate --tool epa_ape --out ape_config.json
epa_fig
epa_fig re-renders serialized plot bundles produced by tools such as epa_ape and epa_rpe.
Common options:
--out_dir: directory for rendered figures--save_plot: custom output name stem--dpi: output resolution--list: list figure names in a bundle without rendering
Example:
epa_fig outputs/ape_plot.json --save_plot outputs/ape_rerender.png
Common Recipes
Run one pair end to end:
epa example_data/example_groundtruth.csv example_data/example_estimation.txt
Inspect alignment before metric evaluation:
epa_traj --format tum --sync --align --ref 1 gt.tum est.tum --plot
Compute APE with explicit sync tolerance:
epa_ape tum gt.tum est.tum \
  --pose_relation trans_part \
  --t_max_diff 0.02 \
  --t_offset 0.0 \
  --plot
Compare two previous runs:
epa_res outputs/results/run_a.zip outputs/results/run_b.zip \
  --metric ape \
  --stage step3 \
  --stat rmse \
  --plot
Config Priority
All core tools support --config <file.json>.
Priority order:
- values loaded from
--config - values passed on the command line
- defaults stored through
epa_config